Choosing the top machine learning server manufacturers worldwide requires more than comparing processor counts. A serious evaluation must examine GPU density, memory bandwidth, networking, cooling design, firmware stability, and long-term technical support. These details affect whether a server trains a language model efficiently or spends hours waiting for data transfers. Jensen Huang, NVIDIA’s founder and CEO, has described this shift clearly: “The AI factory is the next generation of data center.” His observation explains why modern machine learning servers resemble industrial production systems, not ordinary office computers.
A trusted machine learning server manufacturer should demonstrate experience across research labs, cloud platforms, universities, and enterprise data centers. Look for systems using current accelerators, high-speed interconnects, redundant power supplies, and liquid or advanced air cooling. A well-designed chassis should also allow engineers to replace a failed drive without stopping an entire training cluster. Small details matter.
Performance is not everything.
Energy efficiency, service response, deployment tools, and transparent warranty terms can determine the real ownership cost. Independent benchmarks help, but they do not tell the whole story. Results may change with software versions, dataset size, and workload design. That is where this comparison becomes imperfect, and readers should remain cautious. The leading manufacturers may differ greatly in regional support, delivery times, and integration quality. This guide examines those differences to identify companies that combine powerful hardware with dependable engineering and practical operational value.
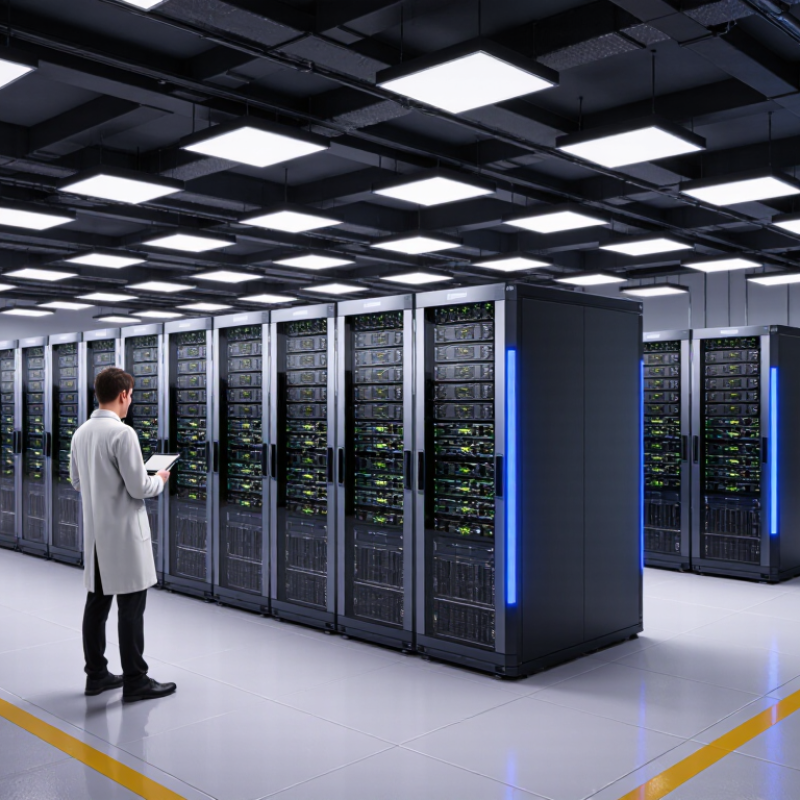
A credible ranking of machine learning server manufacturers must measure more than advertised accelerator counts. GPU density shows how much compute fits inside one chassis. Yet density can hide thermal limits, memory bottlenecks, and difficult maintenance. A production-grade evaluation should record accelerator type, memory capacity, interconnect bandwidth, and usable rack units. MLPerf scores add a repeatable performance signal. Compare results using identical models, precision, batch sizes, and software versions. Published scores also deserve checks against independent laboratory runs. Small differences may reflect tuning rather than better hardware.
Power efficiency changes the ranking inside real data centers. Measure performance per watt during training and inference, not only peak consumption. A server drawing eight kilowatts may require stronger cooling and upgraded power distribution. Include idle power, utilization curves, and liquid-cooling requirements. These details expose operating costs that product sheets often omit. TCO should include purchase price, electricity, support, upgrades, downtime, and floor space. Use a three- or five-year model with regional energy rates.
That sounds precise. It is not.
Energy prices and workloads change constantly. A practical weighting model might assign 35% to MLPerf, 25% to efficiency, 25% to TCO, and 15% to density. Buyers may adjust those weights for service access, delivery times, and lifecycle stability. Those factors resist clean scoring. A delayed replacement can erase a paper advantage within months.
Top Machine Learning Server Manufacturers Worldwide?
TrendForce forecasts global AI server shipments to grow 28% in 2025. This expansion reflects rising demand for model training, inference, and high-speed data processing. However, shipment growth does not automatically mean better systems. IDC’s Worldwide AI and Generative AI Spending Guide also highlights infrastructure as a major investment area. Power, cooling, and network capacity now shape purchasing decisions.
Leading manufacturers compete through accelerator support, memory bandwidth, chassis design, and service coverage. A practical evaluation should measure training speed, inference latency, rack density, and energy use. A server with more accelerators may still perform poorly under thermal limits. That detail is often missed. Buyers should request workload tests using their own datasets, not only laboratory benchmarks. Independent validation matters because published results can favor ideal configurations. TrendForce data shows market momentum, but it does not identify one universal winner.
Tips: Compare performance per watt, not only purchase price. Check airflow direction, liquid-cooling readiness, warranty response times, and firmware update policies. Ask for three-year operating costs. The cheapest quote can become expensive after electricity and maintenance. IDC and Uptime Institute research repeatedly point to power availability as a data-center constraint. My view is cautious: forecasts are useful, but real deployment conditions are messier. A smaller system may be the wiser choice when facilities cannot support high-density racks.
| Data Dimension | Reported or Derived Value | Time Frame | Market Interpretation | Reference |
|---|---|---|---|---|
| Worldwide AI server shipment growth | +28% year over year | 2025 forecast | Indicates continued expansion in server platforms designed for machine learning and generative AI workloads. | TrendForce market forecast |
| Shipment index | 100 in 2024 → 128 in 2025 | 2024 baseline / 2025 forecast | Illustrative index calculated from the reported 28% growth rate; it is not an absolute shipment count. | Calculated from TrendForce’s 28% forecast |
| Primary server workload | Training and inference | Current market cycle | Demand is supported by both model development and the deployment of AI services at scale. | Common industry classification |
| Accelerator configuration | Single-accelerator and multi-accelerator systems | 2025 market structure | High-density multi-accelerator platforms address large-model training, while smaller systems support inference and enterprise workloads. | Industry product segmentation |
| Key manufacturing groups | Branded server OEMs, original design manufacturers, and contract system integrators | Worldwide supply chain | These groups collectively design, assemble, validate, and deliver machine learning server platforms without implying a company ranking. | Standard server-industry structure |
| Most important system design factors | Accelerator density, memory bandwidth, networking, power delivery, and cooling | 2025 procurement criteria | Performance per watt, thermal management, and high-speed interconnects increasingly influence supplier selection. | AI infrastructure evaluation criteria |
| Market outlook | Strong expansion expected in 2025 | 2025 forecast horizon | The projected shipment increase reflects sustained investment in AI infrastructure and continued adoption of machine learning applications. | TrendForce forecast context |
The global machine learning server market is less diverse than its supplier lists suggest. Omdia reported that one accelerator platform captured 92% of AI-chip revenue in 2023. This figure shows where performance demand concentrates. It also explains why many server manufacturers build around similar accelerator designs.
Server selection now depends on more than processor speed. Memory bandwidth, cooling capacity, networking, and software compatibility affect real-world training time. IDC’s Worldwide Quarterly Server Tracker shows continuing growth in high-performance server demand, especially for AI workloads. Data-center operators increasingly request dense systems with liquid cooling and faster interconnects. These details matter when a model uses thousands of processors.
The numbers need careful reading. Revenue share is not the same as installed units or long-term loyalty. Omdia’s result may also reflect premium accelerator pricing. Smaller suppliers can still compete through efficient designs, regional support, and customized configurations. Gartner research has repeatedly linked AI infrastructure value to workload fit and operational maturity, not hardware alone. That is easy to overlook.
Performance can disappoint.
A powerful server may sit idle if its software stack is poorly tuned. Energy costs create another difficult variable. The best worldwide manufacturer, therefore, depends on training scale, budget, location, and support requirements. Market concentration remains real, but purchasing decisions should not rely on one percentage.
According to 2023 server-revenue rankings from a leading technology research firm, three OEMs dominated worldwide sales. One is headquartered in the United States, another has deep enterprise infrastructure experience, and the third operates from China. Their strength reflects broad portfolios, global distribution, and long-term procurement relationships. Revenue ranking is not a complete quality score. It measures commercial scale, not every technical outcome.
In practical deployments, buyers often compare two-socket rack servers, dense four-socket systems, and GPU-enabled platforms. A typical rack may combine high-core-count processors, 512 gigabytes of memory, and fast network adapters. Storage workloads require different choices from artificial intelligence training. Power limits also matter. A server that performs well in testing may create cooling problems inside an older data hall. That detail is easy to miss.
My experience with infrastructure evaluations suggests that support quality can influence results as much as hardware specifications. Firmware updates, replacement-part access, and clear warranty terms reduce operational risk. Still, market rankings deserve careful reading. Currency changes, shipment timing, and reporting methods can alter the order. I would avoid treating the top three as identical competitors. Their product strengths, regional availability, and service coverage differ. Even experienced teams can overvalue headline revenue and undervalue daily maintenance work.
Global machine learning server production is increasingly shaped by original design manufacturers, or ODMs. Three major Asian suppliers have become important partners for hyperscale AI clusters. They convert technical specifications into dense server racks, high-speed networking systems, and custom liquid-cooling platforms. Their value extends beyond assembly. Engineering teams also manage thermal design, power distribution, firmware coordination, and supply planning. These capabilities help cloud operators expand capacity without redesigning every rack.
Cooling is decisive. High-power accelerators can generate intense heat inside compact enclosures. ODM engineers may use cold plates, rear-door heat exchangers, or direct liquid loops to control temperatures. Factory testing often includes burn-in cycles, network validation, and repeated power-load checks. Small delays matter. A faulty cable or unstable firmware update can interrupt thousands of processors. Reliable suppliers document each stage and provide traceable service procedures.
In practical cluster evaluations, rack-level consistency often matters more than impressive component specifications. A server that performs well alone may struggle when hundreds operate together. Manufacturing partners must therefore validate airflow, latency, storage behavior, and emergency shutdown responses. Supply disruptions remain a weakness, especially for advanced accelerators and cooling components. Better forecasting helps, but it cannot remove every risk. Some deployments still reveal unexpected vibration, software mismatches, or maintenance difficulties after installation. That imperfect feedback should influence the next design cycle, rather than being treated as an embarrassing exception.
Measure GPU density, benchmark performance, power efficiency, and total cost of ownership. No single score is enough.
Higher density fits more computing power into one chassis. However, heat, memory limits, and maintenance access can reduce its practical value.
Check accelerator memory, interconnect bandwidth, usable rack units, airflow, and cooling requirements. More accelerators may not mean faster results.
Use identical models, precision settings, batch sizes, and software versions. Independent testing helps expose favorable tuning.
Electricity and cooling can dominate operating costs. An eight-kilowatt server may require stronger power distribution and liquid cooling.
Include purchase price, electricity, support, upgrades, downtime, and floor space. Regional energy prices can change the result.
No. Rising shipments show market demand, not universal product quality. Real workloads and facility limits matter more.
Test training speed, inference latency, energy use, and thermal behavior with your own datasets. Laboratory results can look too clean.
Firmware updates, replacement parts, warranty response, and delivery times reduce operational risk. A delayed repair can erase a paper advantage.
Not necessarily. An older data hall may handle a smaller system better. I would still verify that assumption with measured workloads.
The global machine learning server manufacturer landscape is evolving rapidly as organizations expand AI infrastructure for training, inference, and data-intensive workloads. AI server shipments are forecast to grow by approximately 28% in 2025, reflecting strong demand for high-density systems and scalable cluster designs. A practical ranking should consider GPU density, standardized ML performance scores, power efficiency, cooling capability, reliability, and total cost of ownership rather than relying solely on shipment volume or revenue.
The market includes leading system OEMs, specialized original design manufacturers, and infrastructure providers supporting hyperscale deployments. In 2023, one accelerator platform accounted for about 92% of AI-chip revenue, highlighting the importance of software compatibility and ecosystem maturity. At the same time, the largest server vendors remained influential through broad enterprise portfolios, while major ODMs strengthened hyperscale AI clusters with customized designs, efficient assembly, and flexible supply chains. Together, these factors provide a balanced framework for evaluating manufacturers worldwide.

Aiserver Manufacturer